Where to start discovering the data-driven platform
How can you start to convert data into useful insights? During the webinar, it became clear that 60% of those present are still looking for answers to this question. First and foremost, it's important to understand what such a process involves and what is required. If all these steps are consolidated, the result is what is known as a data-driven platform.
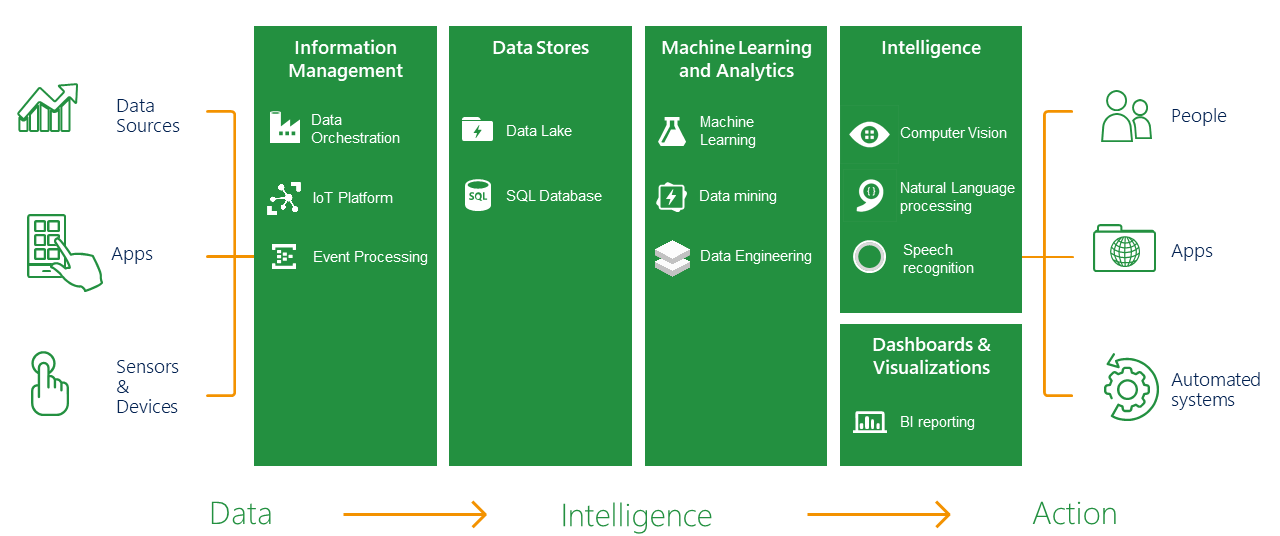
In essence, this is a platform that receives data, processes it as it comes in, processes it again, then combines and enriches it before finally generating relevant results/output. If we look more closely, we see the various 'silos' that the data moves through, pictured from left to right. Please note that these are not actual silos; they often flow into each other seamlessly or even overlap. The platform and its components provide an impression of the steps your data may (but does not always have to) undergo.
First, we look at the data capturing phase. Where is the data coming from? What existing data sources are available? Is the data supplied live? Is there batch processing? What about unreliable data, e.g. if a sensor stops working? In short, what quality data can be useful?
After this – or concurrently (remember, no silos) – consider your storage options. Is the data already well-structured (meaning it can go to relational databases, for example) or not? Is the data based on text? Video? Audio? Documents that require scanning? These are the type of questions that will determine how you construct your data platform. Generally, there won't be a single answer, but a combination of different data stores.
The data has been stored securely and correctly. Now what? It's time to put it to effective use. Many people consider this step akin to a black box; it's absolutely essential to the process, but also quite technical and therefore harder to grasp. This is where the data engineers get to work with machine learning and data mining models. They translate specific business logic into formulas and models, building a smart layer that lives on top of the existing data.
The final interpretation is accomplished by means of dashboards (possibly real time) and visualizations using Microsoft Power BI reporting techniques. Examples include reports analyzing sales figures or customer cluster analyses. Such insights can also be used to feed systems that will then act automatically depending on these results.
How far are you in your data journey?
Are you still in the exploration phase, have you made a few steps, or are you already looking further ahead? Wherever you are in your data journey, our experts are eager to discuss your next steps and guide you on your way.